Features

Read the weekly number from a live dashboard, not a spreadsheet

Rebuilding the same spreadsheet every week costs you hours and, worse, decision quality. We connect your CRM data to live dashboards so the report builds itself while you work.

At a glance

  • Live KPI dashboards
  • Pipeline health and conversion
  • Performance by rep
  • Activity impact analysis
  • Product and segment breakdown
THE PROBLEM

Living in spreadsheets costs more than it looks

  • Assembling reports takes 2-4 hours per person each week, which adds up to 8-16 hours a month.
  • A formula range shifts or a date column stays text, and decisions get made on wrong numbers.
  • In the "report_final(2).xlsx" chaos, nobody agrees which file is current.
  • You see the number but not the reason, so nobody knows which stage lost the deal.
  • Detail questions in the meeting end with "let me check and get back to you."
THE FIX

How we set up your reporting

First we clean up pipeline stages and required fields, because dirty data never produces a trustworthy report. Then we build separate dashboards for executives, team leads and reps.

  • Deals, contacts, products, activities, quotes, invoices and calls join one data model.
  • KPI tiles show total revenue, win rate and average deal size in real time.
  • Stage conversion analysis shows exactly where opportunities fall out.
  • The weekly forecast separates closed revenue from projected revenue.
  • You drill from a dashboard tile to the deal and from there to the call recording.
  • Board decks get PDF/Excel exports, or you simply share the live dashboard link.
Productivity dashboard with a percentage gauge, ongoing and completed task counts and a daily activity chart

All your CRM data in one model

Bitrix24 automates sales reporting end to end: deals, contacts, companies, products, activities, quotes, invoices, and calls all meet in a single data model.

Weekly views and KPIs are calculated from that model in real time. The report stops being something you prepare and becomes something that builds itself while you work.

  • Deal, contact, company, and product records merge into one model
  • Activity, quote, invoice, and call data feed the same reports
  • KPIs are calculated in real time, with no wait for period close
  • A single source of data keeps different reports consistent with each other
CRM analytics showing the sales funnel with conversion rates and a sales rep performance table below

Live dashboards: the critical questions on one screen

You see the answers to your team's most critical questions on a single screen: funnel health, performance by rep, the weekly revenue trend, and the near-term forecast.

The top row holds cards for This Week's Total Revenue, Win Rate, and Average Deal Size. Dashboards drill down the moment you click: from a card straight to the deal, and from there to the call recording.

  • Top-row KPI cards: this week's total revenue, win rate, average deal size
  • Lead → opportunity → quote → negotiation → won/lost stages with volume and conversion
  • The weekly forecast line separates closed revenue from projected revenue
  • One click takes you from card to deal and from deal to call recording
BI Builder dashboard showing the value, count, average size and lifetime of deals in progress

You see the number and the reason behind it

Knowing total revenue is good; knowing where you're accelerating and where you're losing moves management forward. Bitrix24 exposes cause and effect instead of polished summaries.

When stage conversion, activity impact, and segment breakdown come together, it becomes clear which behavior actually pays off.

  • Stage conversion analysis: exactly which step deals fall out at
  • Activity impact: the link between call, email, and meeting volume and win rate
  • Product and segment breakdown: which product drives growth in which customer type
  • Lost-deal reasons are read as patterns rather than one-offs
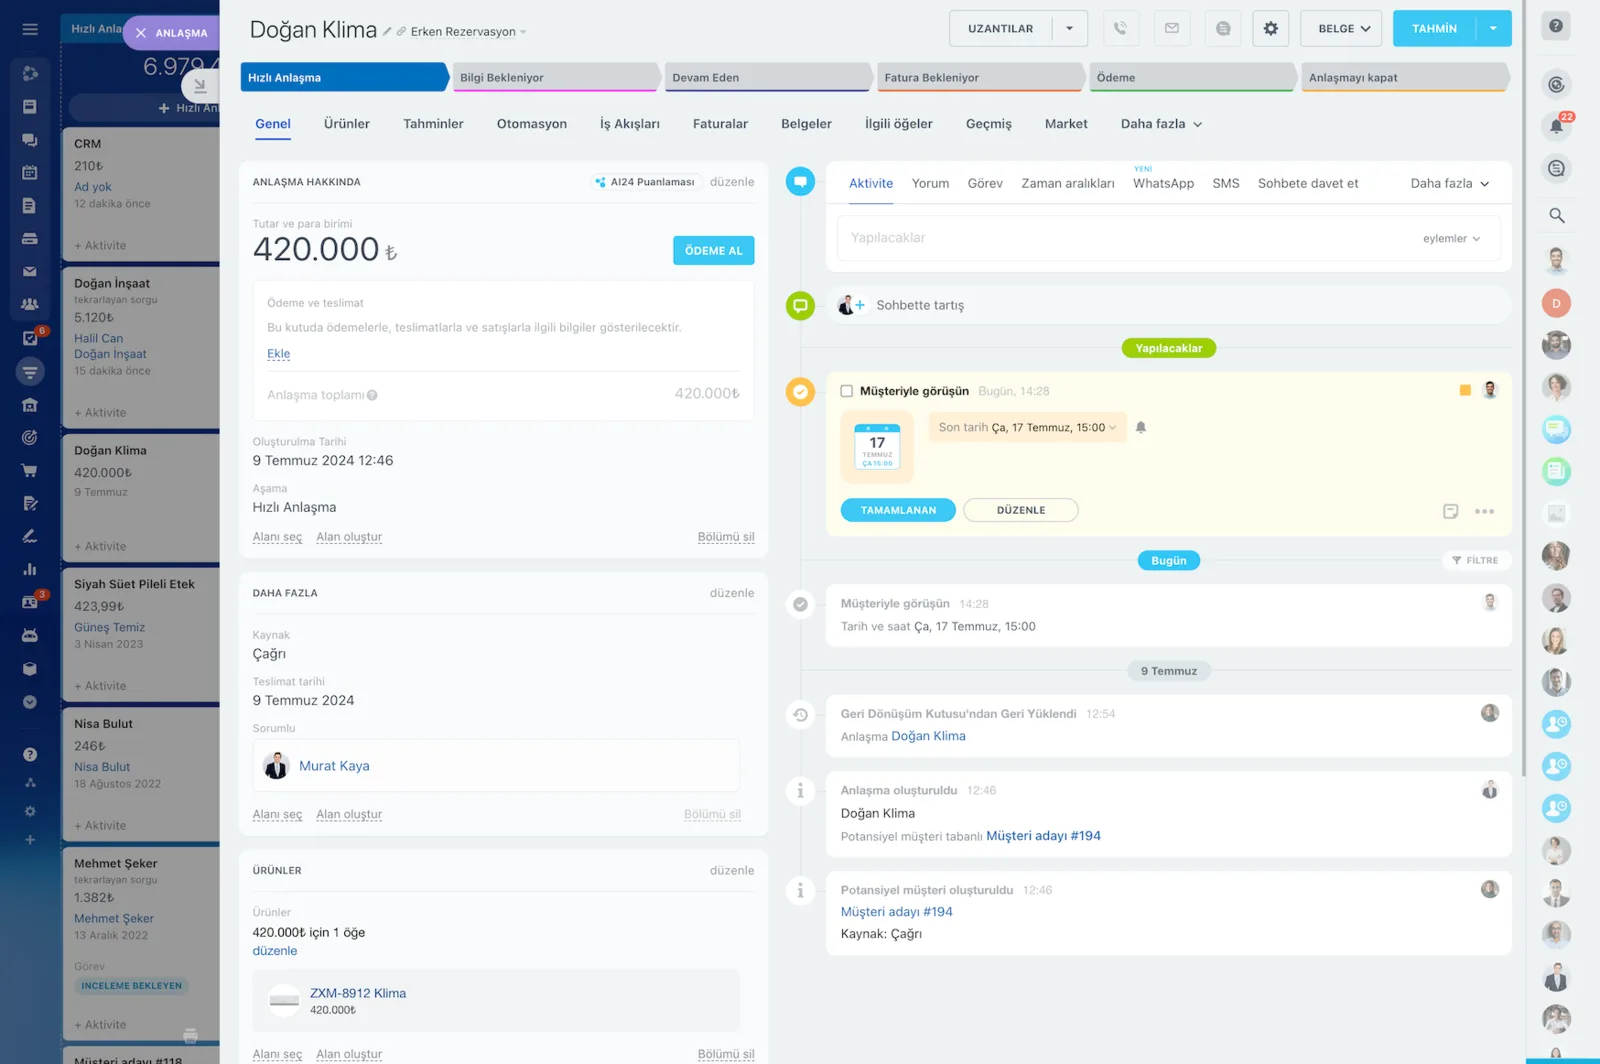
CRM deal card with amount, stage bar and a timeline with activity, WhatsApp and SMS tabs

Escape spreadsheets, but still share freely

You get the relief of leaving Excel behind without abandoning it entirely. You use live dashboards in your daily workflow and share in flexible formats when you need to.

Export to PDF or Excel for a board presentation, or send the dashboard's live link internally without hitting email attachment limits.

  • PDF and Excel export for management presentations
  • Sharing a live link removes attachment size problems
  • Write findings inside the dashboard and tag the people involved
  • A dashboard summary can be emailed automatically on the schedule you choose
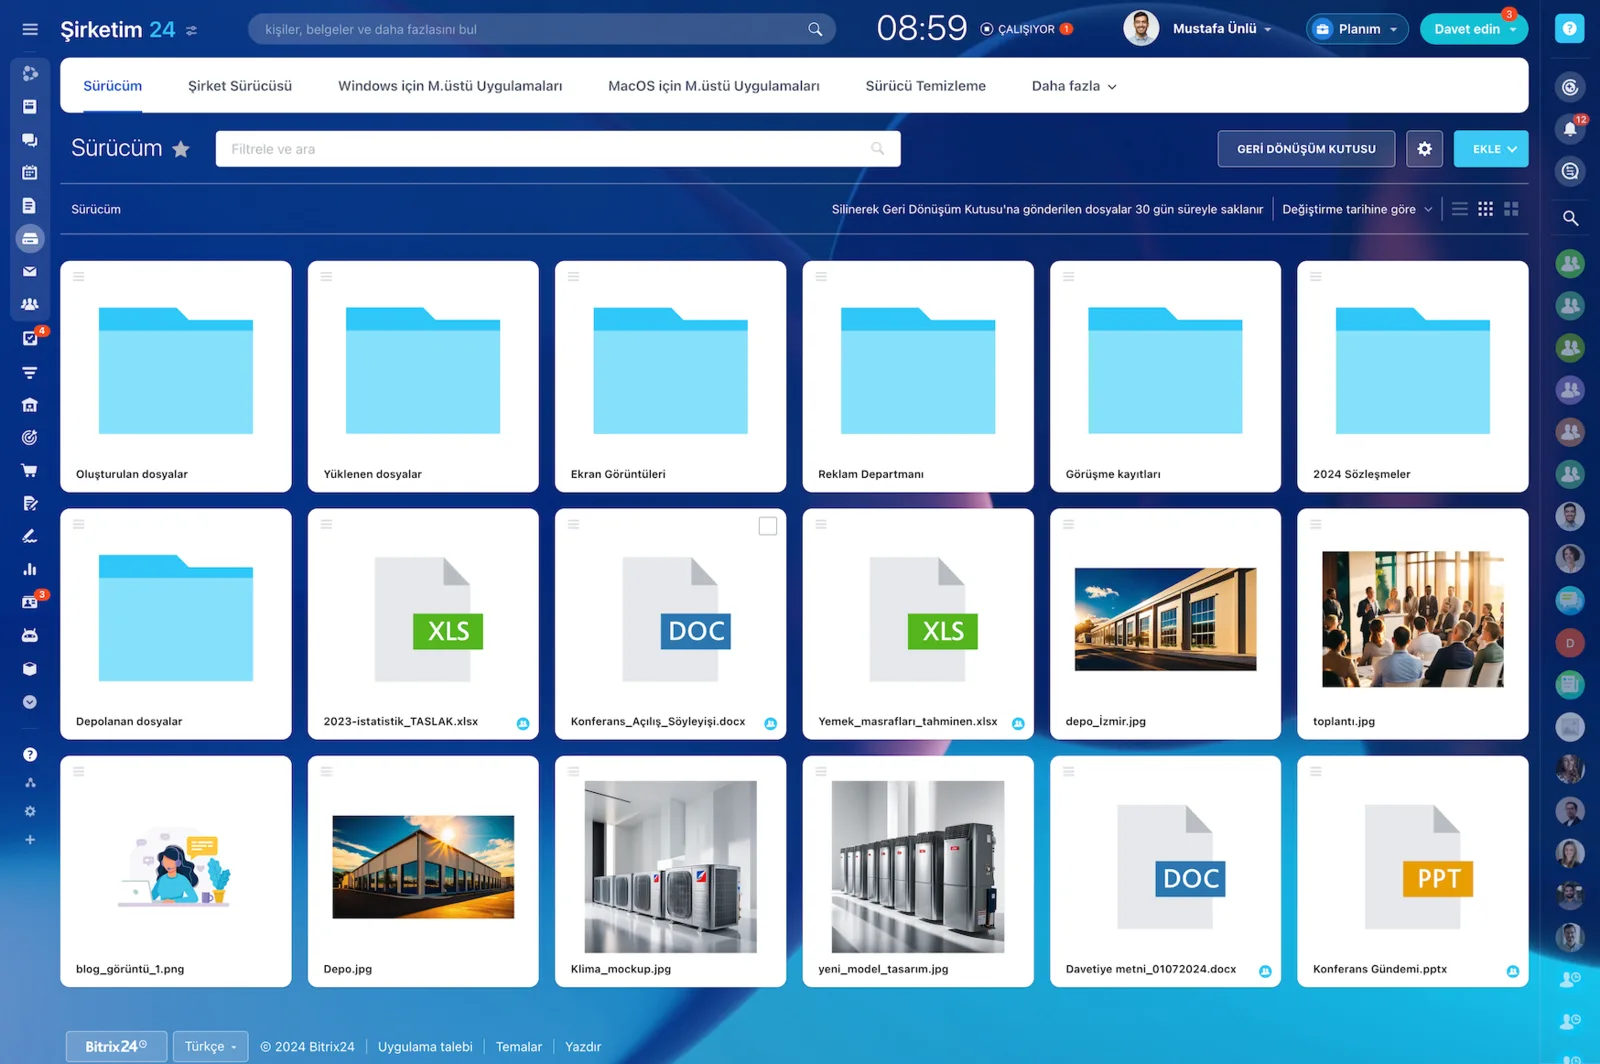
Bitrix24 Drive showing folders and files as cards, including XLS, DOC and PPT documents and images

Permissions, transparency, and traceability

It matters that the right person sees the right data at the right level of detail.

Bitrix24 offers enterprise-grade access control, from role-based permissions to detailed audit logs, so you never have to trade security for speed. During setup we define together who sees what.

  • Different visibility levels for management, team leads, and reps
  • Field- and dashboard-level permissions: specific widgets open only to the right roles
  • Dashboards are shared by user, group, or department
  • Detailed audit logs make it traceable who accessed what
Access Permissions screen assigning full access, limited access or administrator roles to users and groups
CAPABILITIES

What you get

Live KPI dashboards

Revenue, win rate, average deal size and activity volume calculate in real time. The Monday meeting starts by opening a screen, not by prepping a deck.

Pipeline health and conversion

Lead, opportunity, quote, negotiation and close stages show counts and conversion rates. Bottlenecks become a measurement, not a hunch.

Performance by rep

Compare volume, conversion and average cycle time per person. Coaching conversations start from concrete numbers.

Activity impact analysis

See how call, email, and meeting volume correlates with win rate. It becomes clear which behaviors actually move deals forward.

Product and segment breakdown

Isolate which product drives growth in which customer segment. Resources then shift toward the side that is actually growing.

Role-based visibility

Executives, team leads and reps each see the right level of detail. Permissions go down to the widget and field level, with an audit trail.

BEST FIT

Who is this for?

These are the teams we deploy this module with most often. If your scenario is not listed, let's talk it through anyway.

  • Sales managers still running the weekly meeting off a spreadsheet
  • Companies comparing performance across several teams or territories
  • Executives who want the forecast grounded in data rather than gut feel
  • Sales operations teams systematically reviewing why deals are lost
  • Growing SMBs that owe the board a regular reporting cadence

How would this work in your process?

In a free 30-minute call we listen to your workflow and map out how this would run in your company.

Book a free consultation
SETUP

How we roll it out

We handle the setup; you just walk us through your process.

  1. 01

    We define the sales funnel

    We set up the real flow of your sales process (lead → opportunity → quote → negotiation → won/lost) in the CRM with stage names, required fields, and allowed values. Simplifying the stages directly improves report accuracy.

  2. 02

    We connect the data sources

    We set up web form, email, and call integrations so activity data reaches reports without manual entry. Standardizing source tags lets the channel breakdown build itself.

  3. 03

    We build the Weekly Management Dashboard

    We create, save, and share a dashboard of KPI cards, funnel view, and forecast line with the relevant roles. Narrower views for team leads and reps are defined at the same time.

  4. 04

    We embed recording discipline in the team

    Report accuracy starts with data discipline, so we show the team which field to fill and when. In the first weeks we back this with automated reminders for missing data and read the dashboard together.

Works together with

CRM deals, contacts, and companiesProduct catalogQuotes and invoicesCloud telephony and call recordingsEmailWeb formsBI BuilderREST APIPDF and Excel export

Frequently Asked Questions

What do we need to do for the reports to be accurate?

Data discipline. During setup we simplify stage definitions, decide which fields are mandatory and train the team on the logging standard. Dashboard accuracy starts there.

Can we add our own custom metrics?

Yes. We define custom fields and calculated indicators for your metrics. For more complex needs we can feed your external BI tool through BI Builder or the REST API.

Will reps see each other's numbers?

That's your call. With role-based access we can scope it so reps see only their own portfolio, leads see their team and management sees everything.

Can we receive reports by email on a schedule?

You can. We build automation that sends a dashboard digest to the right people on your chosen cadence, and PDF/Excel export is always available on demand.

Let's configure this around your business

Book a free intro call and we'll walk through your process and show which settings fit you.