Features

Know who is overloaded from data, not from a hunch

A performance conversation should start from data both sides accept. We configure Bitrix24's task reports, workload charts and efficiency scores around the way your company actually works.

At a glance

  • Task efficiency score
  • Workload distribution chart
  • Automated periodic reports
  • Supervisor scoring
  • Work schedule tracking
THE PROBLEM

Measure performance by feel and nobody is satisfied

  • You only find out who is genuinely busy and who is idle when someone complains.
  • Work piles onto the same few people, who burn out while others coast.
  • Weekly reports arrive by email and nobody can search the archive afterwards.
  • Delays are never recorded, so reviews turn into a debate about impressions.
  • Departments cannot be compared because each one uses its own yardstick.
THE FIX

A performance picture nobody can argue with

We bring tasks, time records and the reporting cycle into one structure. Managers see who is working on what in real time, and employees know their contribution is on record.

  • Daily, weekly and monthly employee reports are collected in-system, approved or returned with comments.
  • The report wizard lets us build custom reports with fields specific to each department.
  • Reports repeat automatically on the cycle you choose, so nobody has to chase them.
  • A workload chart shows each person's open tasks and project involvement at a glance.
  • The share of tasks closed on time and without objection is calculated automatically into an efficiency score.
Productivity dashboard with a percentage gauge, ongoing and completed task counts and a daily activity chart

Every piece of work ends with a report

Bitrix24 lets you collect several types of work report from your team, and each of them can be customized the way you want.

That matters most for remote and hybrid teams, where a manager cannot look over everyone's shoulder. You accept a report, reject it or add your comment, and no assessment gets buried in an email archive.

  • Daily, weekly and monthly standard reports are collected inside the system.
  • The report wizard builds reports with custom fields for a department or even one employee.
  • A report can repeat automatically on the reporting period you choose.
  • Comments and approvals stay on record and can be read back at the end of the period.
Weekly work report window with the per-employee report calendar behind it

Distribute workload from a chart, not a hunch

Bitrix24 tracks the time employees spend on a given task and their involvement in projects.

That data becomes a chart with a detailed per-employee breakdown, so you can see at any moment who is doing what and how busy they are. Assigning the next piece of work becomes a decision you can look up.

  • The task involvement chart gives a detailed breakdown per person.
  • Open task counts and project involvement appear side by side on one screen.
  • Overloaded and idle team members are spotted during the period, not after it.
  • Planning rests on the real workload data of the previous period.
Resource monitoring report comparing planned labour cost against time actually spent

Work schedules and time tracking

Work schedules in Bitrix24 let you set clock-in and clock-out times, weekly working days, and break times and durations.

With the built-in online time clock, your team starts, pauses and ends the working day from a phone or a laptop. The collected working time data accumulates on the manager's screen.

  • Clock-in and clock-out times, working days and breaks are set per person or per team.
  • Different schedules can run at the same time for shift-based teams.
  • Starting and ending the day works the same on desktop and on mobile.
  • Planned schedule and recorded time are compared side by side.
Work Time screen listing daily working hours per employee together with deviation warnings

Supervisor scores become KPIs

Every report can be approved or rejected, and optionally given a positive or negative score. That data is collected automatically and later used to calculate KPIs for the period.

Performance conversations then rest on a record built over months rather than on the impression of a single meeting.

  • A positive or negative score per report is one-click feedback from the manager.
  • Scores accumulate automatically; you keep no separate evaluation sheet.
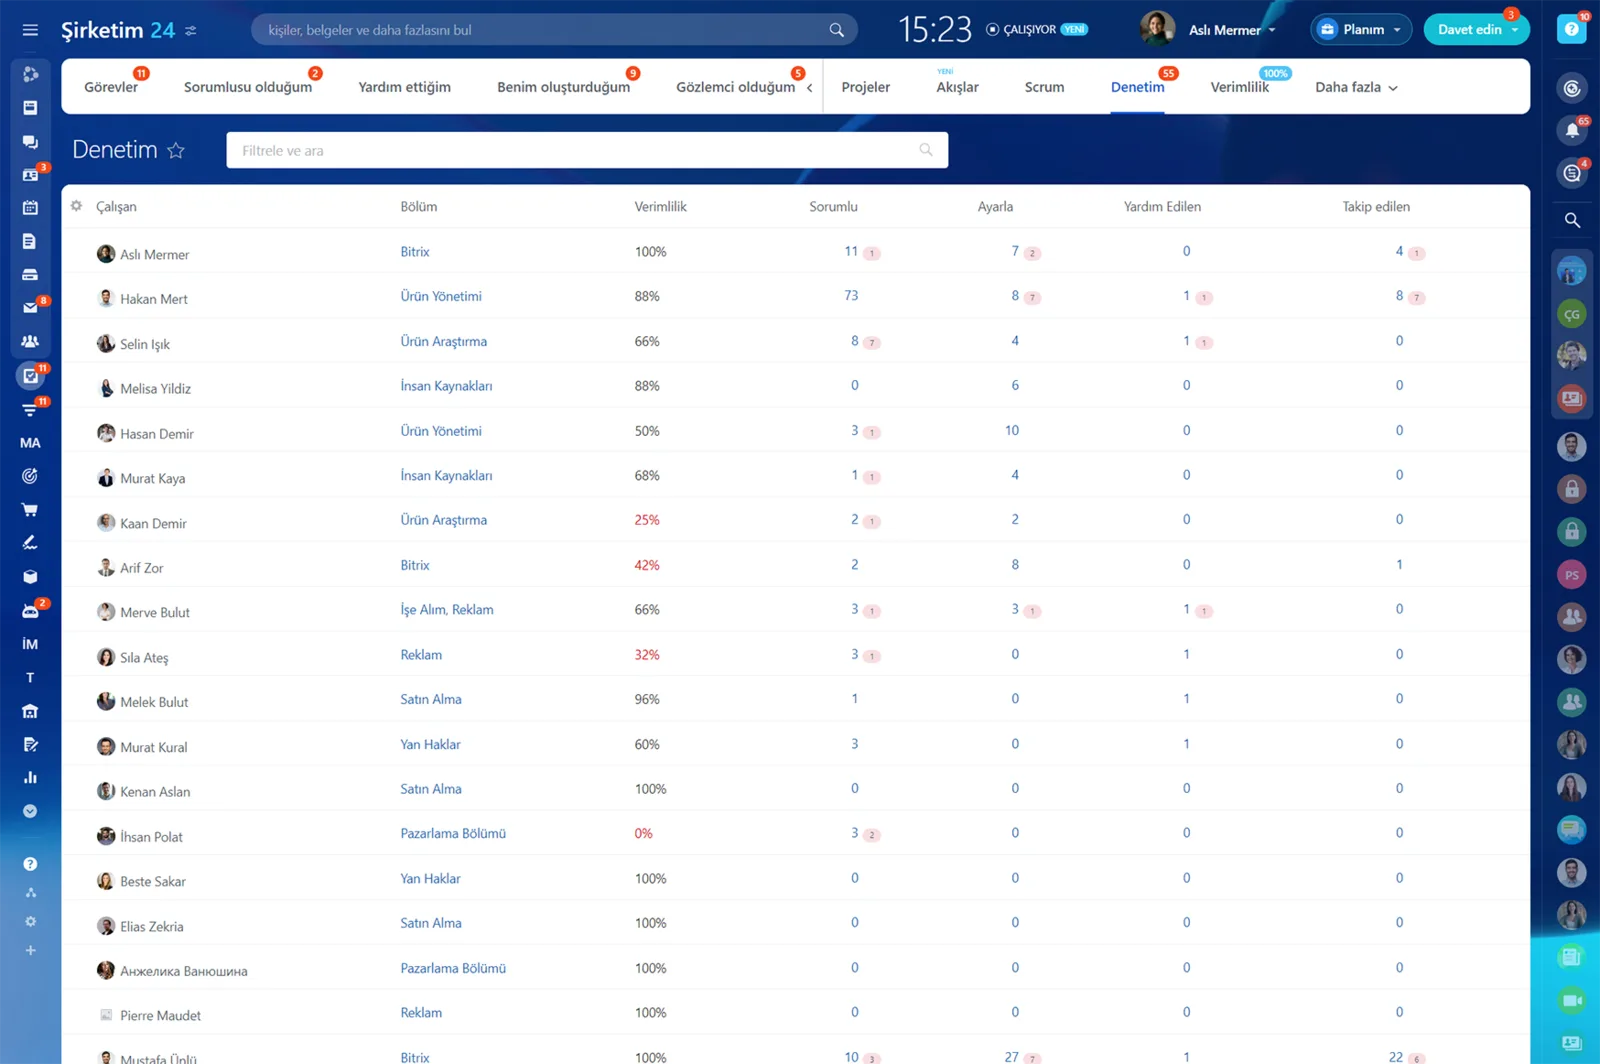
  • Task efficiency can be viewed by employee or by department.
  • Bonus and career conversations use the same data everyone can see.
Supervision screen listing efficiency percentage and the number of owned and tracked tasks per employee

What is measured is the work, not the person

Bitrix24's performance tools do not watch screens or keystrokes; they look at whether the assigned task was completed on time and without objection.

During setup we agree who sees which data, so transparency does not cost you trust. Employees work knowing their contribution is on record.

  • The unit of measurement is the task: delivery time, quality and completion rate.
  • Employees see their own data, managers their team, executives department totals.
  • The metric set is defined in a workshop before setup, around your business.
  • Reporting rules can be updated later without rebuilding the structure.
Supervision report table with employee, department, efficiency percentage and task counts
CAPABILITIES

What you get

Task efficiency score

Every task assigned to a person is tracked automatically, and the share closed on time and without objection is reported by individual and by department. The more tasks someone completes on time and without objection, the higher their efficiency score.

Workload distribution chart

A per-person breakdown of task involvement shows who is doing what and how busy they are at any moment. You assign the next piece of work by looking at capacity rather than guessing.

Automated periodic reports

The system starts the weekly or monthly reporting cycle itself. Missing reports show up as gaps on the manager's list.

Supervisor scoring

Each report can be approved or rejected and given a positive or negative score. That data accumulates and feeds the end-of-period KPI calculation.

Work schedule tracking

Start and end times, working days and break rules are defined per team. For shift-based groups, plan and actual sit side by side.

BEST FIT

Who is this for?

These are the teams we deploy this module with most often. If your scenario is not listed, let's talk it through anyway.

  • Agency, software and consulting teams working project by project
  • Operations managers balancing workload across several departments
  • HR teams that want reviews grounded in evidence
  • Companies managing remote or hybrid teams
  • Shift-based field and support teams

How would this work in your process?

In a free 30-minute call we listen to your workflow and map out how this would run in your company.

Book a free consultation
SETUP

How we roll it out

We handle the setup; you just walk us through your process.

  1. 01

    Metric workshop

    With HR and department heads we decide which metrics actually mean something in your business and which breakdowns need reporting.

  2. 02

    Reports and schedules

    We configure standard and custom reports, their automatic repeat cycles, and work schedules that match how your company actually operates.

  3. 03

    Permission and visibility plan

    We define who sees which data by role, with separate views for employees, managers and executives.

  4. 04

    Training and first-period follow-up

    We walk the team through reporting and scoring, then stay with you through the first cycle to fine-tune the setup against real data.

Works together with

Task and project managementTime tracking and work schedulesCompany structure and department hierarchyReports and analytics dashboardsBitrix24 mobile appREST API and Bitrix24 Market apps

Frequently Asked Questions

Is this employee surveillance?

No. What gets measured is the work itself; assigned tasks, completion time and delivery quality; not screen activity. During setup we agree together on who sees which data.

Who can see the reports?

That depends on the permission model. Typically employees see their own data, managers see their team and executives see department totals.

Can we define the performance criteria ourselves?

Yes, and we prefer that you do. In a pre-implementation workshop we identify which metrics are meaningful in your business and build the reports around them.

Let's configure this around your business

Book a free intro call and we'll walk through your process and show which settings fit you.